How to Use Zoning Maps to Identify Development Opportunities in Los Angeles
Developers in Los Angeles face a complex housing market. Land is scarce, costs are high, and zoning restrictions shape every project. One of the most powerful tools for navigating this environment is the zoning map. These maps reveal where and how projects can be built, offering a clear view of both limits and opportunities.
For investors, builders, and property owners, learning how to read zoning maps can turn confusion into strategy. In this article, we explain how zoning maps work, why they matter, and how to use them to find the best development opportunities in Los Angeles.
What a Zoning Map Shows
A zoning map divides the city into districts, each with rules on land use. These maps define whether a lot can hold a single-family home, an apartment building, or a mixed-use project. They also show restrictions on height, density, and parking.
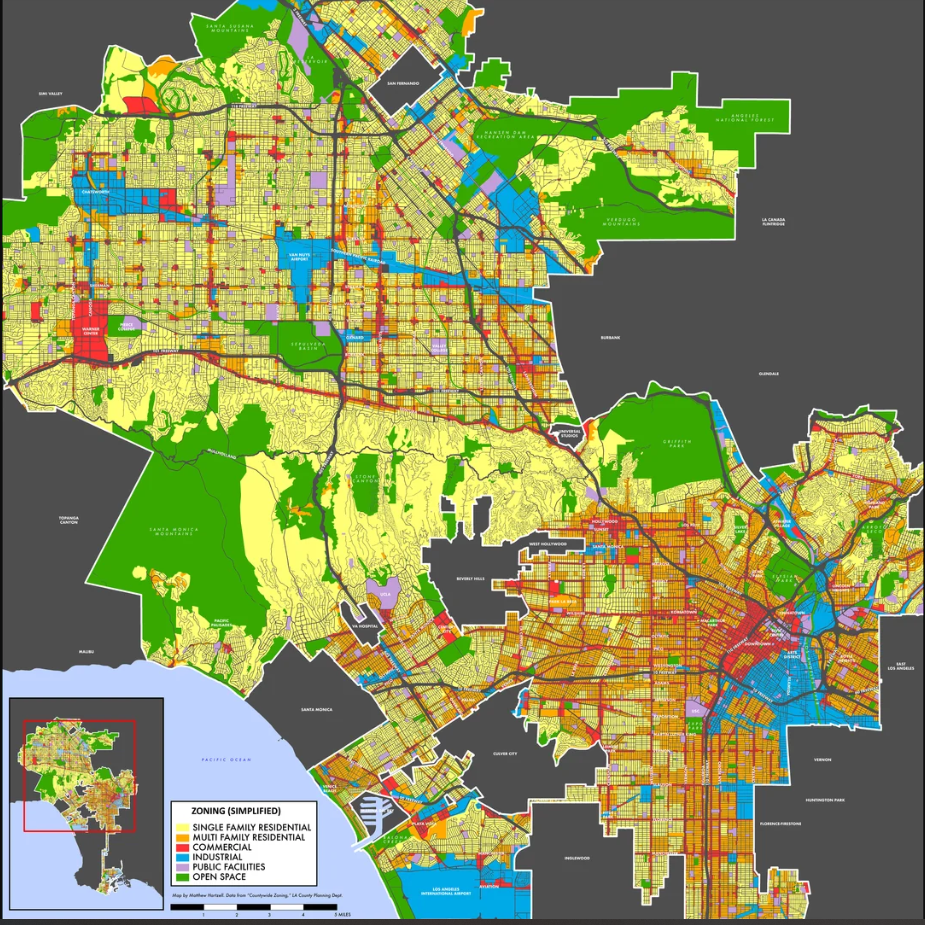
In Los Angeles, zoning codes use abbreviations like R1 (single-family residential), RD1.5 (low-density multifamily), or C2 (commercial). Each code ties back to detailed rules in the city’s zoning ordinance.
For developers, these maps act as a blueprint for what is possible on any parcel of land.
Why Zoning Maps Matter for Developers
Every project begins with land. Before making offers or drawing plans, developers must know what zoning allows. Buying the wrong property without checking zoning can lead to costly delays or even dead-end projects.
Zoning maps matter because they:
Define Use: They determine if land is residential, commercial, or mixed.
Set Density: They limit how many units can be built per lot.
Control Height: They restrict how tall a building can rise.
Shape Parking: They set minimum parking requirements per unit.
Guide Design: They impose setbacks, open space rules, and other standards.
Understanding these details early can save months of work and prevent wasted investment.
Identifying Opportunities in Single-Family Zones
Much of Los Angeles is zoned R1, or single-family. At first glance, these areas seem closed to development. But recent state laws such as SB 9 now allow duplexes or lot splits on some parcels.
For a developer, this creates hidden opportunities. By scanning zoning maps, you can identify R1 parcels near transit, schools, or growing job centers. With the right design and approval strategy, these lots may support more units than before.
Finding Value in Multifamily Zones
Areas zoned RD, R2, or R3 allow higher density. These zones are often concentrated in neighborhoods like Koreatown, Hollywood, or Downtown Los Angeles.
Zoning maps help developers see which blocks are open to apartments and which remain restricted. They also highlight where density bonuses might apply. By layering zoning data with affordable housing incentives, developers can target parcels with the highest yield potential.
Spotting Transit-Oriented Development Areas
Los Angeles is investing heavily in its Metro system. Zoning maps often highlight areas near rail stations that qualify for transit-oriented development (TOD) incentives.
These incentives can reduce parking requirements, increase density, or streamline approvals. For affordable housing developers, TOD areas can mean lower costs and faster timelines. By cross-referencing zoning maps with transit maps, opportunities appear where others may not look.
Understanding Height and Floor Area Limits
Not all zones are created equal. Some allow multifamily but restrict height or floor area. A zoning map paired with the city’s planning documents can reveal these limits.
For example, an RD1.5 parcel may allow multiple units but cap height at two stories. That may fit townhouse-style projects but not mid-rise apartments. Knowing this in advance helps developers match the right design to the right site.
Density Bonuses and Overlay Zones
Beyond base zoning, Los Angeles uses overlays and special zones. These may allow extra density if projects meet certain requirements, such as affordable housing set-asides.
Zoning maps show where these overlays apply. By targeting these areas, developers can unlock higher returns. For example, a parcel with a Transit Oriented Communities (TOC) overlay could allow 50% more units if certain affordability rules are met.
Using Zoning Maps with Market Data
A zoning map alone is useful, but the real power comes when combined with market research. By comparing zoning allowances with current rents, sale prices, or neighborhood growth, developers can identify the strongest opportunities.
For example, a parcel in a gentrifying neighborhood with RD zoning may offer better long-term value than a fully built-out area with the same zoning.
Case Study: Downtown Los Angeles
Downtown LA has seen major growth in the past decade. Zoning maps reveal why: large areas are zoned for mixed-use and high-density development. Combined with incentives, this has allowed developers to create towers, apartments, and retail projects.
By contrast, neighborhoods with similar demand but single-family zoning have seen little growth. The zoning map explains the difference — and guides future opportunity.
How Consultants Use Zoning Maps
For most developers, zoning maps can be overwhelming. Codes are complex, overlays are layered, and updates happen often.
This is where consultants step in. Zoning and entitlement experts interpret maps, translate codes into real-world limits, and find creative solutions. They can spot when a parcel is eligible for a density bonus or when a lot split under SB 9 makes sense.
Working with professionals ensures developers don’t miss hidden opportunities or fall into costly traps.
Practical Steps to Using Zoning Maps
Developers can use zoning maps effectively by following a few steps:
Access the Map: Start with the Los Angeles Zoning Information and Map Access System (ZIMAS).
Check the Code: Identify the zoning code for each parcel.
Review the Ordinance: Look up the rules tied to that code.
Look for Overlays: Check if TOC, Specific Plan, or other overlays apply.
Match to Goals: Decide if the site fits your project type and financing.
Consult Experts: Before moving forward, confirm with zoning consultants or land use attorneys.
Balancing Risk and Reward
Zoning maps don’t guarantee success, but they reveal the playing field. Developers who study them carefully reduce risk and increase reward.
By targeting the right zones, using incentives, and planning around restrictions, affordable housing projects in Los Angeles can move from concept to reality.
Conclusion
In Los Angeles, zoning maps are more than city documents — they are development roadmaps. They show not only what is allowed but where hidden opportunities lie.
For developers and investors, learning to read these maps is essential. Paired with expert guidance, they unlock paths to build the housing Los Angeles desperately needs.
Whether it’s spotting an SB 9 opportunity, using a density bonus, or building near transit, zoning maps guide the way. With the right strategy, they turn restrictions into opportunities and make affordable housing projects possible.
Partner with JDJ Consulting Group to interpret zoning maps and uncover the best development opportunities in Los Angeles. Call us at (818) 793-5058 to schedule your free initial consultation with our zoning experts.
Error: Contact form not found.