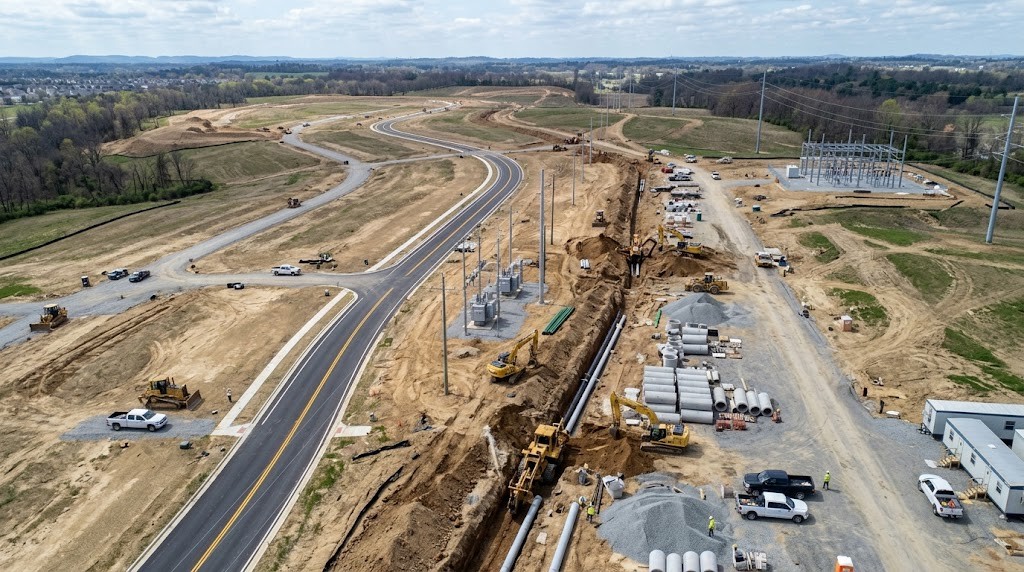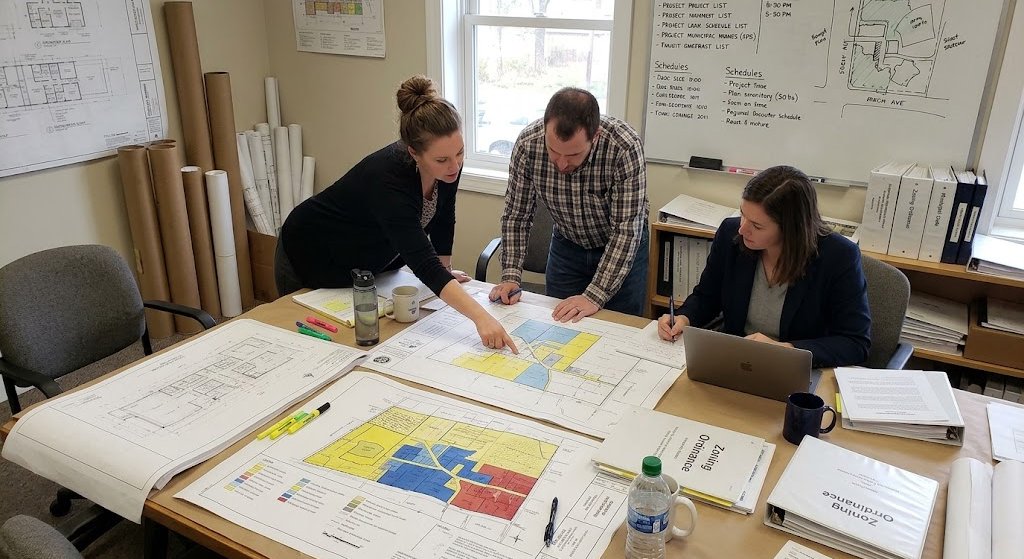

What are visualization tools in land use consulting? Visualization tools are software and digital technologies that help land consultants turn complex property data into simple visuals. These visuals can include maps, 3D models, site plans, zoning overlays, aerial images, and development layouts.
Table of Contents
In land consulting, these tools make it easier to understand a property before starting a project. They help developers, architects, investors, and property owners see what can be built on a site and what challenges may exist.
Instead of reading long zoning documents or technical reports, clients can look at clear visuals and understand the project faster.
Some common visualization tools used in land consulting include:
3D modeling tools
Drone mapping technology
AutoCAD and Civil 3D
Site planning and zoning maps
These tools help with:
zoning analysis,
buildable area studies,
site planning,
feasibility studies,
and development presentations.
For example, a land consultant in Los Angeles may use GIS software to check zoning rules, height limits, parking requirements, and property restrictions. They may also create a 3D model to show how the future project could look on the site.
Visualization tools also improve communication. Clients, city planners, and investors can understand the project more easily through maps and visual presentations.
Today, visualization technology has become an important part of modern land consulting. It helps teams plan projects better, avoid costly mistakes, and make faster decisions.
Why Visualization Tools Matter in Modern Land Consulting
Land development projects are becoming more complex. In cities like LA, properties often have strict zoning rules, height limits, setbacks, and regulations. Because of this, land consultants need better ways to study and present project information.
Visualization tools help make this process easier.
Instead of using only reports and technical documents, consultants can show clear maps, diagrams, and 3D models. This helps clients understand the property faster and make better decisions.
These tools are useful during many parts of a project, including:
site analysis,
zoning research,
feasibility studies,
entitlement planning,
and design presentations.
For example, a developer may want to know if a property can support a mixed-use building. A visualization tool can quickly show:
the buildable area,
possible building height,
parking layout,
and nearby zoning restrictions.
This saves time and reduces confusion.
Visualization tools also improve communication between consultants, architects, engineers, investors, and city departments. Everyone can review the same visual information and stay aligned throughout the project.
Another major benefit is accuracy. These tools help identify problems early, such as slope issues, easements, or setback conflicts. Finding these issues early can help avoid expensive changes later.
Today, visualization technology is an important part of modern land consulting. It helps development teams plan smarter, present ideas clearly, and move projects forward faster.
How Technology Is Changing Development Planning
Technology has made land development much easier. Years ago, consultants used paper maps, manual measurements, and basic drawings. The process was slower and less accurate.
Today, things are different.
Land consultants now use digital tools to study properties, create site plans, and show project ideas more clearly. These tools help save time and reduce mistakes.
For example, consultants can now:
check zoning rules faster,
create 3D building models,
study property conditions,
and map land data in minutes.
This helps clients understand a project before construction even starts.
Technology also improves planning. A consultant can quickly identify problems like:
slope issues,
setback limits,
parking challenges,
or restricted buildable areas.
Finding these problems early can save money later.
Modern tools also improve communication. Instead of reading long reports, clients can look at maps, visuals, and 3D studies to understand the project more easily.
In cities like Los Angeles, this is especially important. Development projects often involve strict zoning rules and detailed planning requirements. Visualization tools help consultants explain these rules in a simple and clear way.
Technology also helps teams work together better. Architects, engineers, planners, and consultants can share files online and review updates in real time.
Today, visualization technology is a major part of land consulting. It helps firms plan smarter, work faster, and present projects more professionally.
GIS Mapping Tools Used by Land Consultants in Los Angeles
GIS stands for Geographic Information System. It is one of the most important tools used in modern land consulting.
GIS software helps consultants collect, organize, and study property data using digital maps. Instead of reviewing data manually, consultants can see zoning details, parcel boundaries, and infrastructure all in one place.
This makes planning faster and easier.
Land consultants in Los Angeles often use GIS tools during:
zoning analysis,
feasibility studies,
site selection,
and entitlement planning.
For example, a consultant can use GIS software to check:
zoning overlays,
height restrictions,
transit access,
hillside regulations,
flood zones,
and nearby land use conditions.
This helps developers understand if a property is suitable for a project before moving forward.
GIS mapping is also useful for finding possible risks early. A site may have access problems, environmental limitations, or development restrictions that are not obvious at first.
With GIS tools, consultants can spot these issues quickly.
Some of the most commonly used GIS platforms include:
ArcGIS,
QGIS,
and Google Earth Pro.
ArcGIS is popular for advanced mapping and zoning analysis. QGIS is often used as a lower-cost alternative with strong mapping features. Google Earth Pro is useful for aerial views, site context, and basic property research.
GIS tools also improve presentations. Instead of showing clients complicated zoning reports, consultants can use clear maps and visual data to explain the property more simply.
Today, GIS mapping has become a major part of land development and planning in Los Angeles. It helps consultants make better decisions, improve accuracy, and communicate project information more clearly.
Using ArcGIS for Zoning and Site Analysis
ArcGIS is one of the most widely used mapping tools in land consulting. It helps consultants study properties, zoning rules, and development using interactive digital maps.
In Los Angeles, zoning regulations can be complicated. A single property may have multiple overlays, height limits, parking and land use restrictions. ArcGIS helps organize all this information in one place.
Land consultants use ArcGIS to:
review parcel data,
check zoning layers,
study surrounding properties,
analyze transit access,
and identify development restrictions.
For example, if a developer wants to build a mixed-use project near a transit corridor, ArcGIS can help show:
nearby zoning conditions,
lot dimensions,
surrounding building patterns,
and possible planning limitations.
This helps consultants understand the site before design work begins.
ArcGIS is also useful for feasibility studies. Consultants can compare properties and identify which sites may be better for development.
Another major benefit is visual presentation. Instead of showing clients large spreadsheets or zoning documents, consultants can present data through clean maps and visual reports.
This makes communication easier for:
developers,
investors,
architects,
and planning departments.
ArcGIS also helps improve accuracy. Consultants can study property details more carefully and identify issues earlier in the planning process.
Because of these advantages, ArcGIS has become an important tool for modern land consulting projects in Los Angeles.
How QGIS Helps With Mapping and Planning
QGIS is another popular mapping tool used in land consulting. It works similarly to ArcGIS, but it is free and open-source. Many consultants and smaller firms use QGIS because it offers strong mapping features without high software costs.
QGIS helps land consultants organize and study property data through digital maps. It can be used for zoning research, site analysis, feasibility studies, and planning reports.
Consultants often use QGIS to review:
parcel boundaries,
zoning districts,
environmental conditions,
transit routes,
and nearby land uses.
The software also supports multiple map layers. This makes it easier to compare different property conditions in one view.
For example, a consultant in Los Angeles may use QGIS to study a site’s zoning overlays, slope conditions, and surrounding infrastructure before starting a development plan.
QGIS is especially useful during early project research. It helps consultants quickly understand a property and identify possible development challenges.
Another advantage is flexibility. QGIS supports many file types and allows users to customize maps based on project needs.
Like other visualization tools, QGIS also improves communication. Clear maps and visual data help clients understand site conditions more easily than technical reports.
Today, QGIS has become a valuable tool for land consultants who need accurate mapping, strong planning support, and cost-effective visualization software.
GIS Tools for Feasibility Studies and Property Research
GIS tools play a major role in feasibility studies and property research. Before starting a development project, consultants need to understand what can and cannot be built on a site.
GIS software helps make this process faster and more accurate.
Land consultants use GIS tools to study important property details such as:
zoning regulations,
lot size,
land use restrictions,
access roads,
nearby buildings,
environmental conditions,
and utility connections.
This information helps determine whether a project is realistic before major design or construction work begins.
For example, a developer may want to build apartments on a property in Los Angeles. A consultant can use GIS mapping tools to review:
density limits,
height restrictions,
parking requirements,
transit access,
and nearby zoning overlays.
This helps identify possible issues early in the planning process.
GIS tools are also useful when comparing multiple properties. Consultants can quickly study different sites and determine which location may offer better development potential.
Another benefit is risk reduction. Some properties may have hidden challenges like flood zones, hillside restrictions, easements, or limited access. GIS software helps reveal these issues before a client invests significant time or money into a project.
Because of this, GIS technology has become an important part of modern property research and development planning. It helps land consultants provide clearer insights and better recommendations to clients.
3D Visualization Software for Land Development Projects
3D visualization software helps land consultants turn project ideas into realistic visual models. These tools make it easier to show how a future development may look before construction begins.
Instead of looking at flat drawings or technical plans, clients can view buildings, site layouts, and property designs in a more visual way.
This helps everyone understand the project more clearly.
Land consultants use 3D visualization software during:
feasibility studies,
zoning analysis,
site planning,
investor presentations,
and entitlement reviews.
These tools are useful in cities like Los Angeles, where projects often face strict height limits, setback rules, and design requirements.
With 3D models, consultants can show:
building height and scale,
parking layouts,
open space areas,
surrounding structures,
and possible design impacts.
This helps developers identify problems early and improve project planning before submitting applications.
3D visualization also improves communication with clients, investors, architects, and planning officials. Visual models are easier to understand than technical reports or zoning documents alone.
Some of the most common 3D visualization tools used in land consulting include:
SketchUp,
Revit,
AutoCAD Civil 3D,
and Lumion.
Each tool supports different parts of the planning and design process.
Today, 3D visualization has become an important part of modern land development. It helps consulting teams present projects more professionally. Likewise, it improves accuracy, and makes faster planning decisions.
SketchUp for Early Project Concepts and Massing Studies
SketchUp is one of the most popular 3D modeling tools used in land development and planning. It helps consultants create simple and realistic building models during the early stages of a project.
The software is widely used because it is fast, visual, and easy to understand.
Land consultants often use SketchUp for:
massing studies,
site layout concepts,
zoning presentations,
and early feasibility planning.
For example, if a developer wants to study a mixed-use project in Los Angeles, SketchUp can help show:
building height,
lot coverage,
setbacks,
parking areas,
and overall site layout.
This makes it easier to understand how the project may fit on the property.
SketchUp is especially useful during zoning and entitlement planning. Consultants can create visual models to show clients, investors, and planning departments before final architectural drawings are completed.
The software also helps identify design problems early. Teams can review spacing, building scale, and site limitations before moving deeper into the planning process.
Another major advantage is communication. Many clients are not familiar with technical construction drawings. A 3D model gives them a much clearer picture of the project.
Because of its flexibility and ease of use, SketchUp has become a valuable visualization tool for modern land consulting and development planning.
AutoCAD and Civil 3D for Site Planning and Infrastructure Design
AutoCAD and Civil 3D are important tools used in land development and site planning. These programs help consultants create accurate technical drawings and detailed project layouts.
They are commonly used for:
site plans,
grading plans,
utility layouts,
road designs,
and infrastructure planning.
In land consulting, accuracy is very important. Small errors in measurements or site design can lead to delays and added costs. AutoCAD and Civil 3D help reduce these problems by creating more precise project drawings.
For example, a consultant working on a development project in Los Angeles may use Civil 3D to study:
slope conditions,
drainage systems,
roadway access,
utility connections,
and grading requirements.
This helps the project team understand how the site can be developed safely and efficiently.
Civil 3D is especially useful for larger properties and hillside developments. It can analyze elevation changes and terrain conditions more accurately than basic design software.
Another benefit is better coordination between teams. Architects, engineers, planners, and consultants can all work using the same project files and layouts.
These tools also improve communication during entitlement and permitting reviews. Clear site plans and technical drawings help planning departments review projects more efficiently.
Today, AutoCAD and Civil 3D are widely used throughout the land development industry because they help improve accuracy, planning, and overall project organization.
Revit for Coordinated Project Visualization
Revit is a 3D design and modeling tool used for detailed building visualization and project coordination. It is commonly used by architects, engineers, and development teams during the design phase of a project.
In land consulting, Revit helps teams create more detailed and connected project models. Unlike 3D sketches, Revit models include real building data such as dimensions, materials, and system layouts.
This helps improve planning and coordination.
Consultants and design teams use Revit to:
create detailed building models,
study project layouts,
coordinate architectural and engineering plans,
and improve design accuracy.
For example, a development team in Los Angeles may use Revit to visualize how a proposed building fits within zoning limits.
The software also helps reduce design conflicts. Different teams can review the same model and identify issues before construction begins.
Another major advantage is collaboration. Architects, engineers, and consultants can work together using shared project data. This helps keep the project organized and reduces communication problems.
Revit is also useful for client presentations. Detailed 3D visuals help investors and property owners better understand the project design.
How Drone Mapping Is Improving Land and Site Analysis
Drone mapping has become an important part of modern land consulting. It helps consultants collect accurate aerial data and study properties more efficiently.
Instead of relying only on ground photography or survey images, consultants can now capture real-time aerial views of a site.
This provides a clearer understanding of the property.
Drone mapping is commonly used for:
site analysis,
topography studies,
feasibility planning,
aerial imaging,
and development presentations.
In cities like LA, drone technology is especially useful for large sites, hillside, and hard-to-access areas.
Drone images can help consultants study:
slope conditions,
surrounding development,
access roads,
vegetation,
drainage patterns,
and existing site features.
This helps identify potential development challenges early in the planning process.
Drone mapping also improves accuracy. High-resolution aerial images and terrain data allow consultants to create better site plans.
Another major advantage is presentation quality. Aerial visuals help clients, investors, and planning departments understand the property more clearly.
Drone technology also saves time. Consultants can collect large amounts of site data much faster than manual field reviews.
Benefits of Drone Surveys for Development Projects
Drone surveys have changed the way land consultants study development sites. They make it easier to collect accurate property data without spending days walking large or difficult areas.
In the past, site reviews often took more time and required more manual work. Today, drones can capture detailed aerial images and mapping data much faster.
This helps consultants plan projects more efficiently.
Drone surveys are commonly used to review:
property conditions,
slope and elevation changes,
access roads,
drainage areas,
vegetation,
and nearby buildings.
This information is very useful during feasibility studies and early project planning.
For example, if a developer wants to build on a hillside property in Los Angeles, drone surveys can help consultants better understand the terrain before design work starts.
Another major advantage is visibility. Aerial images give a much clearer view of the entire site and often reveal issues that are difficult to notice from the ground.
Drone visuals also improve communication. Clients, investors, and planning departments can understand the property more easily through aerial maps and site images.
Most importantly, drone surveys help reduce costly surprises later in the project. Finding potential problems early can save both time and money during development.
Because of these benefits, drone technology has become an important part of modern land consulting and site analysis.
Aerial Imaging for Hillside and Large Properties in Los Angeles
Aerial imaging is especially useful for hillside and large properties in Los Angeles. These sites can be difficult to study from the ground because of steep slopes, limited access, or uneven terrain.
Drone technology helps consultants get a full view of the property much faster.
With aerial imaging, land consultants can better understand:
slope conditions,
elevation changes,
nearby structures,
access points,
vegetation,
and overall site layout.
This is important during early planning and feasibility studies.
For example, a hillside property may look buildable at first glance, but aerial images can reveal grading challenges, drainage concerns, or limited construction access. Identifying these issues early helps avoid delays later in the project.
Aerial imaging is also useful for larger development sites. Instead of reviewing separate ground photos, consultants can study the entire property through aerial views.
This makes planning more efficient and improves project accuracy.
Another major benefit is presentation quality. Aerial visuals help clients and investors understand the property more clearly. They also support zoning presentations and entitlement discussions with planning departments.
Visualization Tools Used During Zoning and Entitlement Planning
Visualization tools play an important role during zoning and entitlement planning. They help land consultants study development rules and present project information more clearly.
In Los Angeles, zoning regulations can be complicated. A property may have height limits, setback rules, parking requirements, overlays, and environmental restrictions that affect what can be built.
Visualization tools help organize this information in a simpler and more visual way.
Land consultants often use these tools to create:
zoning maps,
buildable area studies,
site diagrams,
3D massing models,
and entitlement presentation materials.
This helps developers understand a property before investing in design or construction.
For example, a consultant may create a visual study showing how a proposed building fits within zoning limits and site restrictions. This makes it easier for clients and planning departments to review the project.
Visualization tools also improve communication during entitlement applications and public presentations. Instead of reviewing technical zoning reports alone, stakeholders can see clear visuals that explain the project more effectively.
Another major benefit is early problem detection. Consultants can identify issues like:
setback conflicts,
parking limitations,
access challenges,
or reduced buildable area
before moving further into the planning process.
Buildable Area and Density Analysis
Buildable area and density analysis help determine how much development a property can support. This is one of the most important steps in land consulting and project planning.
In cities like Los Angeles, zoning rules often control:
building height,
lot coverage,
setbacks,
parking requirements,
and residential density.
Because of this, consultants need accurate tools to study what can realistically be built on a site.
Visualization software makes this process easier.
Land consultants use digital maps, zoning overlays, and site models to calculate the possible buildable area of a property. These tools also help estimate the number of units, building size, and layout options that may fit within zoning regulations.
For example, a developer planning a multifamily project may want to know:
how many units are allowed,
how much floor area can be built,
and whether the site can support parking and open space requirements.
A buildable area study helps answer these questions early in the planning process.
Density analysis is also important during feasibility studies. It helps developers understand whether a project makes financial and practical sense before moving into design and permitting.
Another major benefit is clarity. Visual studies and diagrams make complex zoning information easier for clients, investors, and planning departments to understand.
Today, buildable area and density analysis are essential parts of modern land consulting because they help improve planning accuracy and support smarter development decisions.
Mapping Tools for Zoning Overlays and Restrictions
Zoning overlays and land use restrictions can have a major impact on a development project. In Los Angeles, many properties are affected by additional planning rules beyond the base zoning code.
This is where mapping tools become important.
Land consultants use visualization software to study zoning overlays and identify restrictions that may affect a property. These tools help organize complex planning information into clear digital maps.
Common zoning overlays may include:
hillside regulations,
transit-oriented communities (TOC),
specific plans,
historic preservation areas,
flood zones,
and environmental restrictions.
A property may look suitable for development at first, but overlays can change what is actually allowed on the site.
For example, a parcel near a transit corridor may qualify for density bonuses. On the other hand, a hillside property may face stricter height or grading limits.
Mapping tools help consultants identify these conditions early.
These visual maps also improve communication with clients and planning departments. Instead of reviewing pages of zoning documents, stakeholders can understand restrictions through simple visual layers.
Another benefit is better project planning. Consultants can use overlay maps to avoid design conflicts and improve feasibility analysis.
Radius Maps and Public Notification Planning
Radius maps are commonly used during zoning and entitlement planning. They help identify nearby properties and support public notification requirements for development projects.
In many LA projects, developers must notify surrounding property owners before hearings or entitlement approvals. Radius maps make this process easier and more organized.
Land consultants use mapping tools to create clear radius maps that show:
nearby parcels,
surrounding streets,
property boundaries,
and notification areas.
These maps help ensure the project follows local planning requirements.
For example, a city may require property owners within a certain distance of a proposed development to receive public notices. Consultants can use visualization software to quickly generate accurate notification maps for the project.
Radius maps are also useful during early planning. They help consultants study nearby land uses, surrounding building patterns, and neighborhood impacts.
Another major benefit is presentation quality. Clear maps help clients, city officials, and community stakeholders better understand the location and scale of project.
Because of this, radius mapping has become an important part of modern zoning and entitlement planning in Los Angeles.
Cloud-Based Tools That Help Development Teams Stay Organized
Modern development projects involve many different people. Architects, engineers, consultants, surveyors, and property owners often need to work together throughout the planning process.
Cloud-based tools make this easier.
Instead of sending large files back and forth through email, teams can share project information online and access updates in real time.
This improves communication and helps keep projects organized.
Land consulting teams commonly use cloud platforms to:
share site plans,
review zoning studies,
manage project files,
track revisions,
and coordinate with clients and consultants.
These tools are especially useful for larger development projects where multiple teams are involved at the same time.
Cloud-based systems also reduce confusion. Everyone can review the latest version of drawings, maps, and reports from one shared location.
Another major advantage is faster collaboration. Teams can quickly comment on files, make updates, and respond to project changes without long delays.
For example, a land consultant in LA may share zoning maps and feasibility studies with architects through a cloud platform. This helps the project move more smoothly.
Improving Collaboration Between Consultants, Architects, and Clients
Good communication is important in every development project. Land consultants, architects, engineers, and property owners all need to stay connected throughout the planning process.
Cloud-based tools help make collaboration much easier.
Instead of waiting for emails or printed drawings, teams can share updates online in real time. This allows everyone to review the latest project information from one place.
These tools help teams:
share files faster,
review site plans,
track project updates,
leave comments,
and coordinate design changes.
This improves teamwork and reduces delays.
For example, a land consultant may upload zoning maps and feasibility studies to a shared platform. It helps architects and engineers review them before starting design work.
Clients also benefit from this process. They can view project updates, site visuals, and planning documents easily without needing software.
Another major advantage is fewer mistakes. When everyone works from the same updated files, there is less confusion about revisions or project requirements.
Managing Project Files and Revisions More Efficiently
Development projects often involve a large number of files, drawings, maps, reports, and design updates. Keeping everything organized can become difficult without the right system.
Cloud-based tools help teams manage project files more efficiently.
Instead of searching through long email chains or outdated folders, consultants and project teams can store everything in one shared location. This makes it easier to access the latest information at any time.
These platforms are commonly used to manage:
zoning reports,
site plans,
GIS maps,
feasibility studies,
architectural drawings,
and entitlement documents.
Another major benefit is version control. As projects change, teams can track revisions and avoid working from outdated files.
For example, if a site layout changes during the planning process, architects, engineers, and consultants can review the updated version.
This reduces confusion and helps prevent costly mistakes.
Cloud-based file management also improves efficiency during entitlement and permitting reviews. Project documents can be shared quickly with clients, consultants, and planning departments anytime.
How Visualization Tools Help Clients Better Understand Development Projects
Land development projects can be difficult for clients to understand, especially when they involve zoning rules, technical drawings, and planning regulations.
Visualization tools make this information much easier to follow.
Instead of reviewing complicated reports or construction plans, clients can look at maps, diagrams, and 3D models that clearly show how a project may look and function.
This improves communication from the beginning of the project.
Land consultants often use visualization tools to explain:
buildable area,
building height,
parking layouts,
zoning restrictions,
site access,
and overall project design.
For example, a developer may want to understand how much of a property can actually be built on. A visual site study can explain this much faster than pages of zoning calculations.
These tools also help clients make decisions more confidently. When project information is easier to understand, it becomes easier to evaluate design options, budgets, and development strategies.
Another major advantage is better presentations. Visual studies are often more effective during investor meetings, entitlement reviews, and planning discussions with city departments.
Making Complex Zoning Information Easier to Understand
Zoning rules can be difficult to understand, especially for property owners and first-time developers. Many projects involve technical terms, overlays, setbacks, parking requirements, and height limits that are not always easy to read in city documents.
Visualization tools help simplify this information.
Instead of reviewing long zoning reports, clients can look at maps, diagrams, and visual studies that explain the property more clearly.
This makes the planning process easier to follow.
Land consultants often use visual tools to show:
zoning boundaries,
buildable area,
setback lines,
parking layouts,
and height restrictions.
For example, a client may want to know why a building cannot extend to a certain part of the property. A visual site diagram can quickly show where setback rules or zoning limitations apply.
These tools also help reduce confusion during planning meetings and entitlement discussions. Clear visuals make it easier for clients, architects, and city officials to review the same information together.
Another major benefit is faster decision-making. When zoning information is easier to understand, clients can move forward with more confidence.
Reducing Delays and Costly Design Changes
Visualization tools help identify project issues early in the planning process. This can reduce delays, redesign work, and unexpected costs later in development.
In many projects, problems are discovered too late. A design may conflict with zoning rules, site conditions, or parking requirements after plans have already been prepared.
Visualization software helps prevent this.
Land consultants can use maps, 3D models, and site studies to review a property before moving into final design and permitting.
These tools help identify issues such as:
setback conflicts,
limited buildable area,
access problems,
grading challenges,
and parking limitations.
Finding these problems early gives the project team more time to adjust the design and avoid expensive revisions later.
For example, a consultant may discover through a site model that a proposed building height exceeds local zoning limits. Identifying this issue during early planning can save significant time during entitlement review.
Visualization tools also improve coordination between consultants, architects, and engineers. When everyone works with the same visual information, projects are often more organized and efficient.
How JDJ Consulting Group Uses Visualization Tools in Land Consulting
Visualization tools are an important part of the planning process at JDJ Consulting Group. These tools help simplify complex land development information and improve project planning.
In LA, projects often involve detailed zoning rules, overlays, feasibility studies, and entitlement. Visualization technology helps organize this data in a way that is easier for clients and project teams to understand.
JDJ Consulting Group uses visualization tools for:
zoning analysis,
GIS mapping,
buildable area studies,
feasibility research,
and site planning support.
These tools help developers understand the potential of a property before moving into design and permitting.
For example, digital mapping and site visualization can help identify:
zoning restrictions,
access limitations,
setback requirements,
parking challenges,
and development opportunities.
This helps clients make more informed decisions early in the planning process.
Visualization tools also improve communication between consultants, architects, engineers, and property owners. Clear visuals and mapping studies make project discussions more productive and easier to follow.
Final Thoughts on Visualization Technology in Los Angeles Land Consulting
Visualization tools have become a major part of modern land consulting. They help turn complex property data into simple visuals that are easier to understand.
Today, developers and property owners want clear answers before starting a project. Maps, 3D models, drone images, and zoning studies help provide those answers faster.
In Los Angeles, this is especially important. Many projects involve strict zoning rules, overlays, parking requirements, and site limitations.
Visualization tools help simplify the process.
They also improve communication between developers, architects, consultants, investors, and city planners. Instead of reviewing long technical reports, teams can understand projects through visual studies.
Another major benefit is better planning. Early site analysis can help identify problems before they become costly delays later.
As technology continues to grow, visualization tools will remain an important part of land development.
At JDJ Consulting Group, these tools help support smarter planning and more efficient land consulting.